From the desk of Jonathan Evans·Brisbane, Australia
The 1945 world horoscope named Russia's era and the Arab Republic's rise before either happened. The same method reads 2026.
Geopolitical crises, commodity shocks, and currency revaluations do not happen at random. Master Sepharial's long-period cycle framework to forecast world-event windows years in advance.
You found Sepharial the way most serious researchers do. A reference in a Gann text. A footnote in a financial-astrology book. A mention of a system that reads world history as a 36-year clock — naming which nation dominates, which social force rises, what kind of pressure an era sustains. The idea stayed because the record was too specific to dismiss. You went looking for the source.
The source is a 1926 book called The World Horoscope. It maps each 36-year era to a zodiac sign, a planetary ruler, and a set of themes. The Aquarian era — 1945 to 1981 — was mapped as Russia's period and the Arab Republic's period, an era of mass movements and popular power. Russia dominated the Cold War. Nasser's Egypt drove the Suez crisis and pan-Arab nationalism. Independence movements swept Africa and Asia. The British Empire ended. Every major theme the system named in 1926 ran in the record from 1945 to 1981.
The trouble is the source itself. The book is written for readers who already knew the Chaldean planetary order, Hebrew notation, and century-spanning tables that carry no legend. Most researchers stop at page ten. The ones who push through finish with a sense of the system and no working procedure for running it. The method was sound. The way in was buried in a language almost nobody reads. This letter is about finding the working order — and the tools that make the method run for any year from 1784 to 2053.
Optional 3–8 min. Author intro, or a proof-of-concept demonstration of the methodology against a historical turning point.
01 · PROPRIETARY MECHANISMS MASTERED
✦ The Sovereign Liquidity Clock™: Multi-decade macro waves that govern sovereign debt defaults and international conflict cycles.
✦ Curiosity Bullet: How Sepharial predicted major geopolitical realignment decades before the events unfolded in international news.
§ The broken tool · Problem mechanism
Standard analysis reads the event. The world cycle reads the era the event grew inside.
Every crisis has two layers. There is the event — the invasion, the election, the default, the crash. And there is the era the event grew inside — the 36-year backdrop that made the event structurally probable. Standard analysis is excellent at the first layer. It names the event, assigns causes, and reads the damage. The second layer is invisible to it. The era that made the event probable is not visible in the news, in economic data, or in the political record. It is visible only in the world cycle — and the cycle shows you the backdrop before the event fills it.
The 1945 world horoscope named Russia's dominance and the Arab Republic's prominence before the Cold War began. The 1939 horoscope showed Cancer rising — a year of emotional upheaval, mass movement, and domestic disruption. Poland was invaded in September. The 1914 horoscope showed Gemini rising with Mars and Saturn prominent — destruction of human relationships and communication breakdown. War came in August. These readings did not predict specific events. They named the character of the year and the type of event that character favours. That is a different instrument from the one that reads events after they happen.
There is only one place that instrument was written down. Sepharial mapped it in 1926, on a 36-year clock anchored to the Chaldean order of the planets. But the source is nearly unreadable. Written in Cambridge-scholar notation for readers who already held the system cold, it uses coded planetary markers and century-spanning tables with no legend. The method survived. The working order was lost. Four layers of the system sit in public domain and stay unread, because almost nobody finds the sequence that makes them run.
The rising sign defines the environment, the thematic backdrop, the dominant global focus for that twelve-month period.
The four gaps that break most attempts at the system are always the same.
01
No era context
Every event has a backdrop. The Aquarian Phase from 1945 to 1981 gave Russia its century. Every geopolitical move in that period ran inside a planetary structure that favoured Aquarian nations. Without that backdrop, each event looks isolated. With it, the events become expressions of the era — which means the type of event was probable before the specific one arrived.
02
No 432-year map
The same era returns every 432 years. The Aquarian Phase of 1513 to 1549 mapped to the Aquarian Phase of 1945 to 1981 — same dominant nations, same social forces, same themes, different century. Modern analysis treats each decade as unprecedented. The world cycle treats it as the fourth or fifth time this combination has run. Historical repeats give you what the current record cannot: structural depth.
03
No country forecast
Each nation governs a zodiac sign. When a year's rising sign matches a country's sign, that nation carries the year's story. Without country charts, the world cycle gives you a global climate but no named actor. With them, the forecast narrows from "a year of structural tension" to "a year of structural tension running through this nation" — before the headlines decide which one.
04
No second clock
Gann's 49-year Fatal Year cycle runs independently. When the world cycle's inflection falls near a Fatal Year, two independent systems point at the same window. One reading is an interpretation. Two independent clocks pointing at the same year is a reason to study it seriously. Without the second clock, the world cycle gives you one signal. Together, they give you convergence or contradiction — which is itself information.
A working reading goes in order. First the era: the 36-year phase and its planetary ruler. Then the year: its world horoscope and the type of pressure it favours. Then the nation: which country's sign is prominent. Then the second clock: does the Fatal Year converge nearby. The next section is how each layer is built.
§ The method — built in five layers
The five layers exist in the source. Only one sequence makes them run.
Sepharial's book has been in print since 1926. The working order for reading it has not. What follows is the sequence that turns five coded tables into a reading you can run on any year from 1784 to 2053.
The book worked. The way in did not. Four years to find the difference.
I spent four years with the 1926 text. It is written in Cambridge-scholar language — Hebrew planetary notation, coded tables that span centuries, assumptions on every page that the reader already knows the Chaldean order cold. Most researchers stop at page ten. I nearly did. What kept me was the record. Every claim the book made, I checked. The Aquarian Phase mapped as Russia's era, the Arab Republic's era, an era of mass movements and popular power. I checked it against 1945 to 1981. The record confirmed every major theme.
So the method was sound. The problem was the order. Each reading took an afternoon of hand calculation before I had anything to interpret. The work was all setup and nothing else. I kept asking: in what sequence does this book want to be read? Not "is the system true?" — the historical record was answering that. "What is the working order?" That question took longer than the verification.
The day it clicked, I stopped reading the book as vague predictions and started reading it as structural cycle logic. Era first. Year second. Nation third. Fatal Year fourth. Read in that sequence, the coded tables stop being a wall and start being a procedure. Once I held the order, I could build the tools to run a reading in minutes instead of an afternoon. The work moved from calculation to interpretation — which is where the real study lives. Those tools became this course. What follows is the same sequence, taught the way I would teach a research partner.
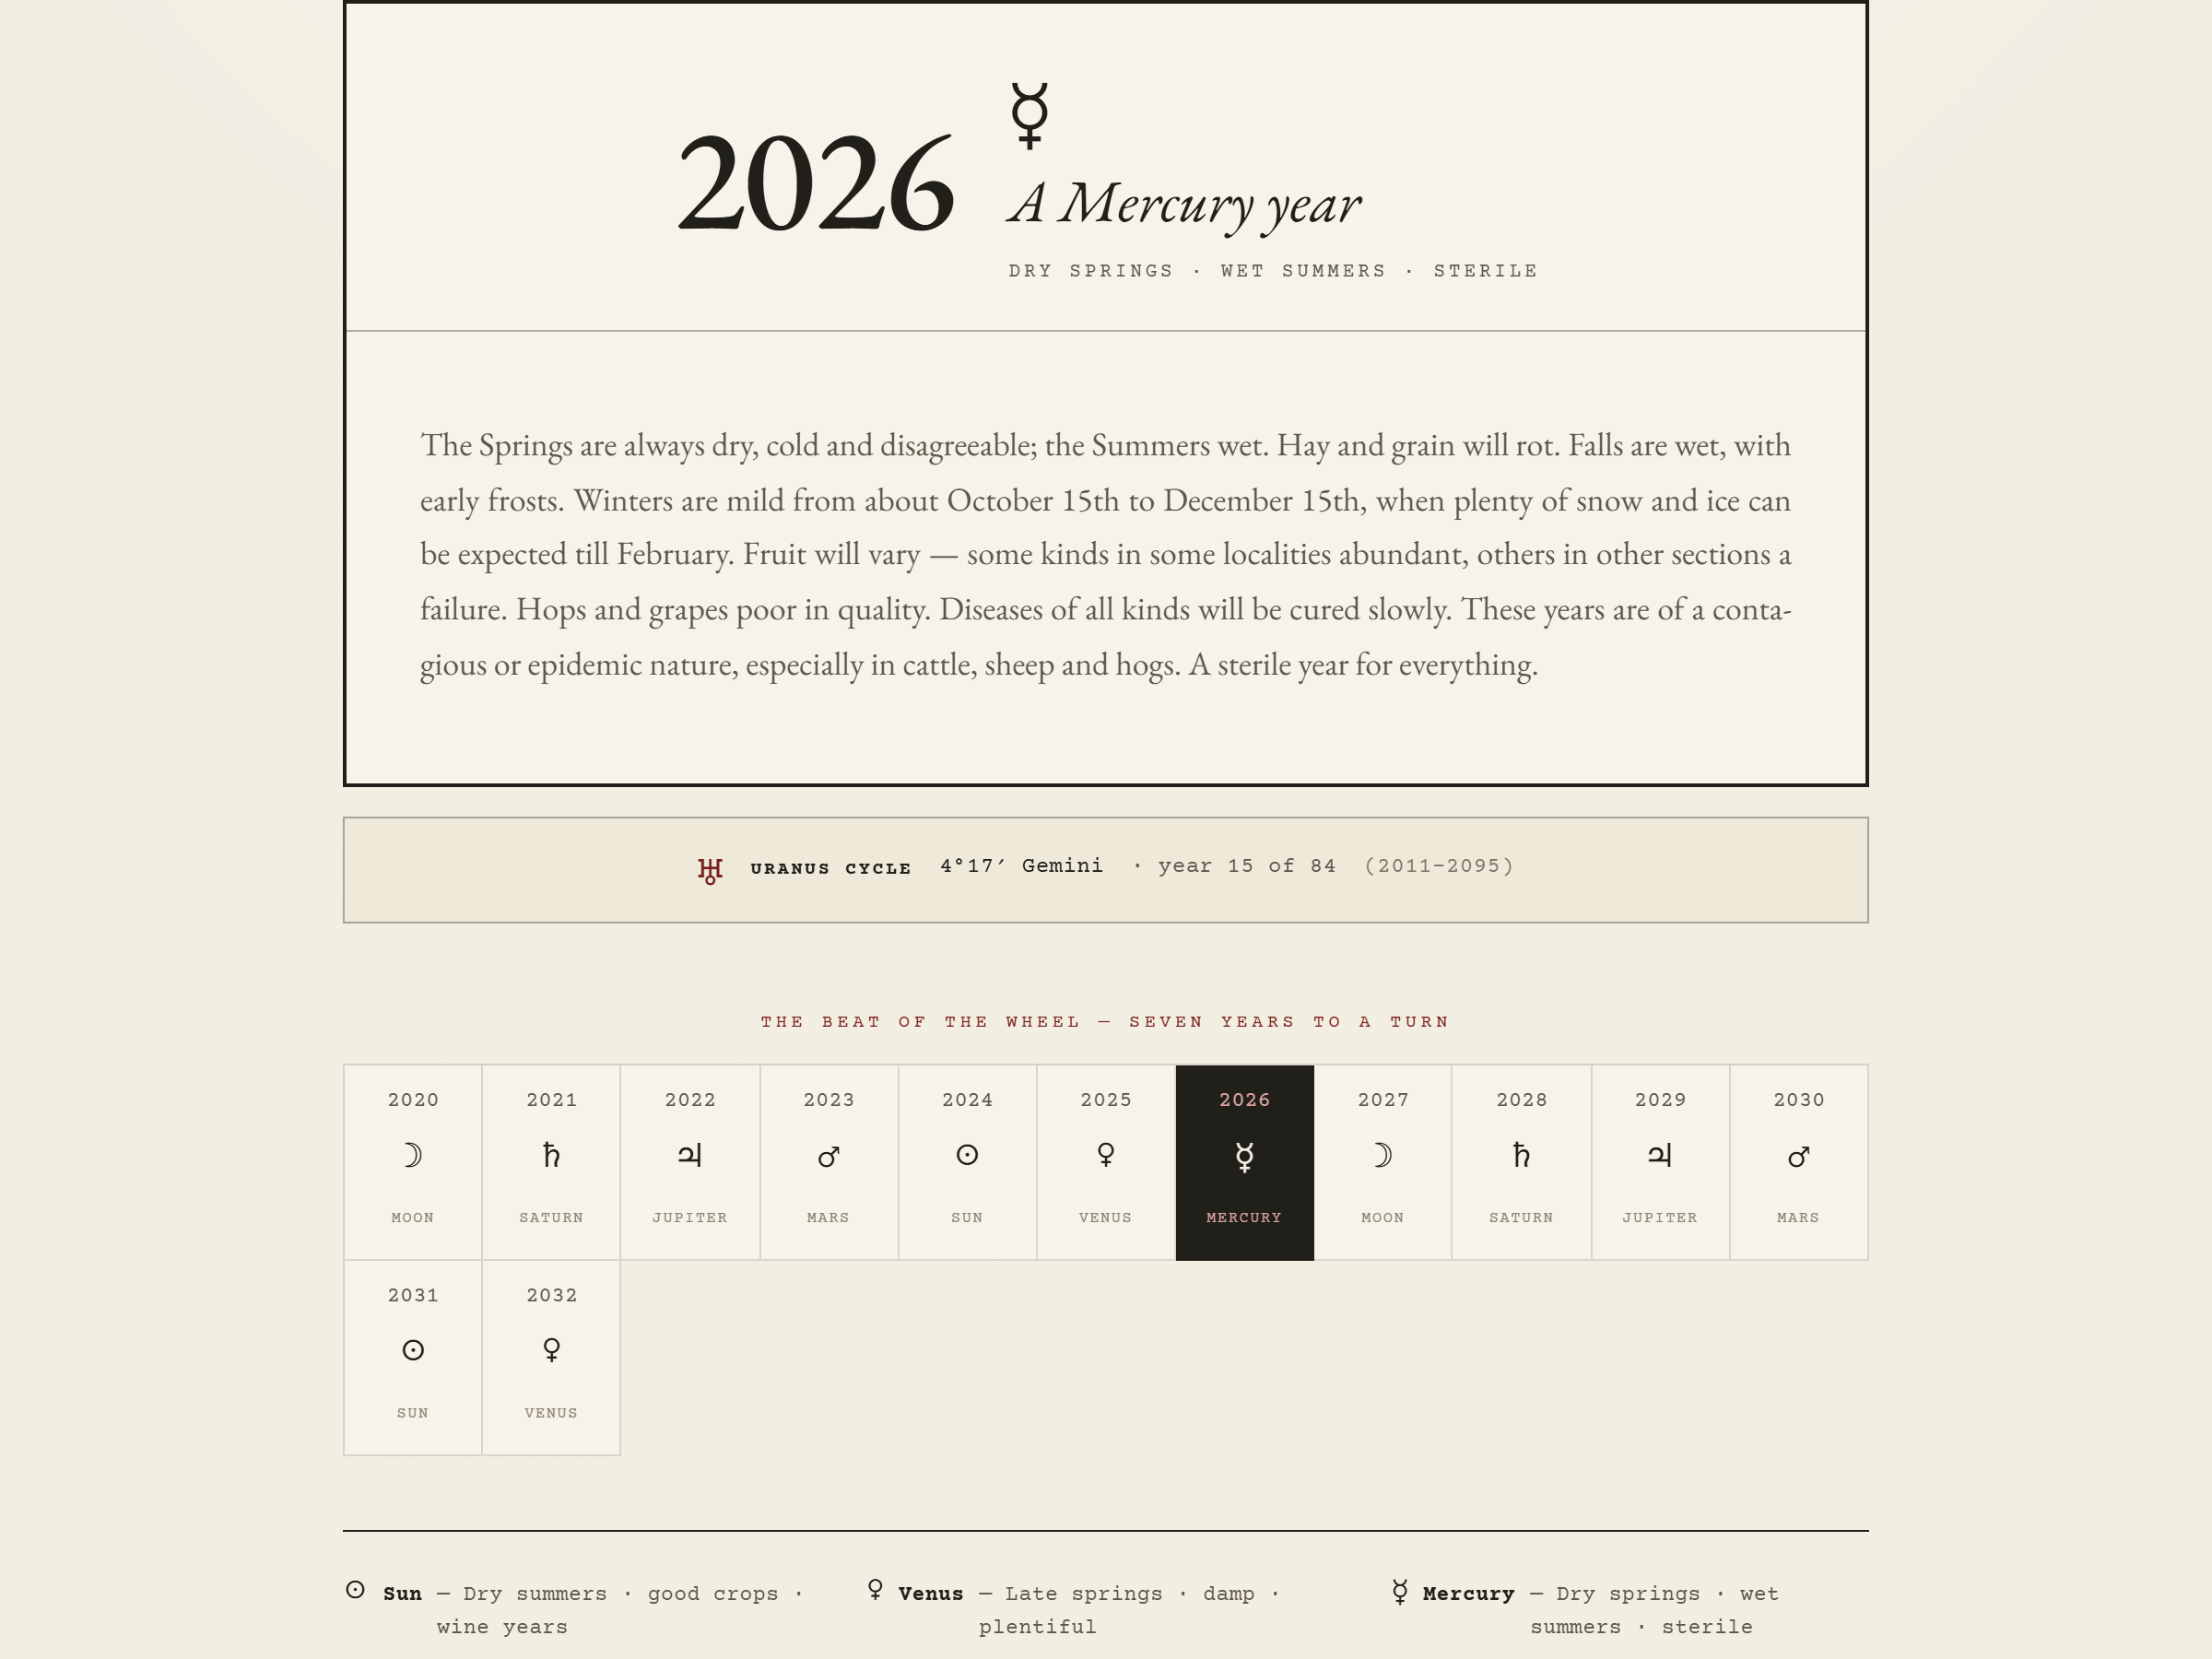
1
The era — the 36-year phase
Every era has a planetary ruler and a rising sign, and the ruler's character defines the era's theme. The Aquarian Phase from 1945 to 1981 was governed by the Moon — mass movements, popular power, the tide of public sentiment as the dominant force. The Piscean Phase from 1981 to 2017 was governed by Jupiter — expansion, religious revival, dissolution of borders. The current Aries Phase from 2017 to 2053 is governed by Saturn — hard authority, national boundaries, structured power. You learn to locate the phase you are standing in, name its ruler, and identify the prior periods that carry the same structure. The Aquarian Phase of 1513 to 1549 maps to 1945 to 1981. The themes repeat. The nations are different. The structural echo tells you what kind of world the phase favours before the decade has found its name.
Layer one is the grand strategy: the era's ruler sets the climate for everything that follows.
2
The year — its world horoscope
Inside the era, each year has its own world horoscope: a rising sign, planetary rulers, and a 12-house structure. The rising sign sets the year's theme. The ruler of the sign determines the type of pressure the year favours — structure, conflict, expansion, dissolution. The 1939 world horoscope shows Cancer rising, governed by the Moon: emotional upheaval, domestic disruption, mass movement of people. Poland was invaded in September. The 1914 horoscope shows Gemini rising with Mars and Saturn prominent: breakdown of communication, destruction of human relationships. War came in August. You learn to build the world horoscope for any year from 1784 to 2053 and read its structure before the events that express it arrive.
The rising sign defines the environment, the thematic backdrop, the dominant global focus for that twelve-month period.
3
The nation — the country chart
Each nation governs a zodiac sign. The United States answers to Gemini. Russia answers to Aquarius. Britain answers to Aries. China answers to Cancer. Germany answers to Scorpio. France answers to Leo. When a year's rising sign matches a country's governing sign, that nation is accentuated — it carries the year's story. When Aquarius rises, Russia and the United Arab Republic are spotlit. When Cancer rises, China and the mass of the public carry the story. You learn the spotlight check: which nation's sign is prominent in this year's world horoscope, and what that activation historically produces. The country-chart table is inside the course. What you carry out is the ability to run the check and name the nation before the year writes its record.
4
The 432-year repeat — history as the research instrument
The same 36-year era recurs every 432 years. Twelve eras of 36 years each. The Aquarian Phase of 1513 to 1549 maps to 1945 to 1981. The Piscean Phase of 1549 to 1585 maps to 1981 to 2017. Each pair carries the same planetary ruler, the same rising sign, the same structural theme. The nations are different; the forces are the same. You learn to use the prior period as a research document — not because history repeats identically, but because the structural echo tells you what kind of events the phase favours, 432 years before they happen. The 1513-1549 period saw England and France in tension over dominance of northern Europe. The 1945-1981 period expressed the same tension through Britain's decline and the Common Market's rise. Same structure. Different century. You use the earlier period to build a research frame for the current one — which means 600 years of documented record become part of your reading before you look at a single news headline.
5
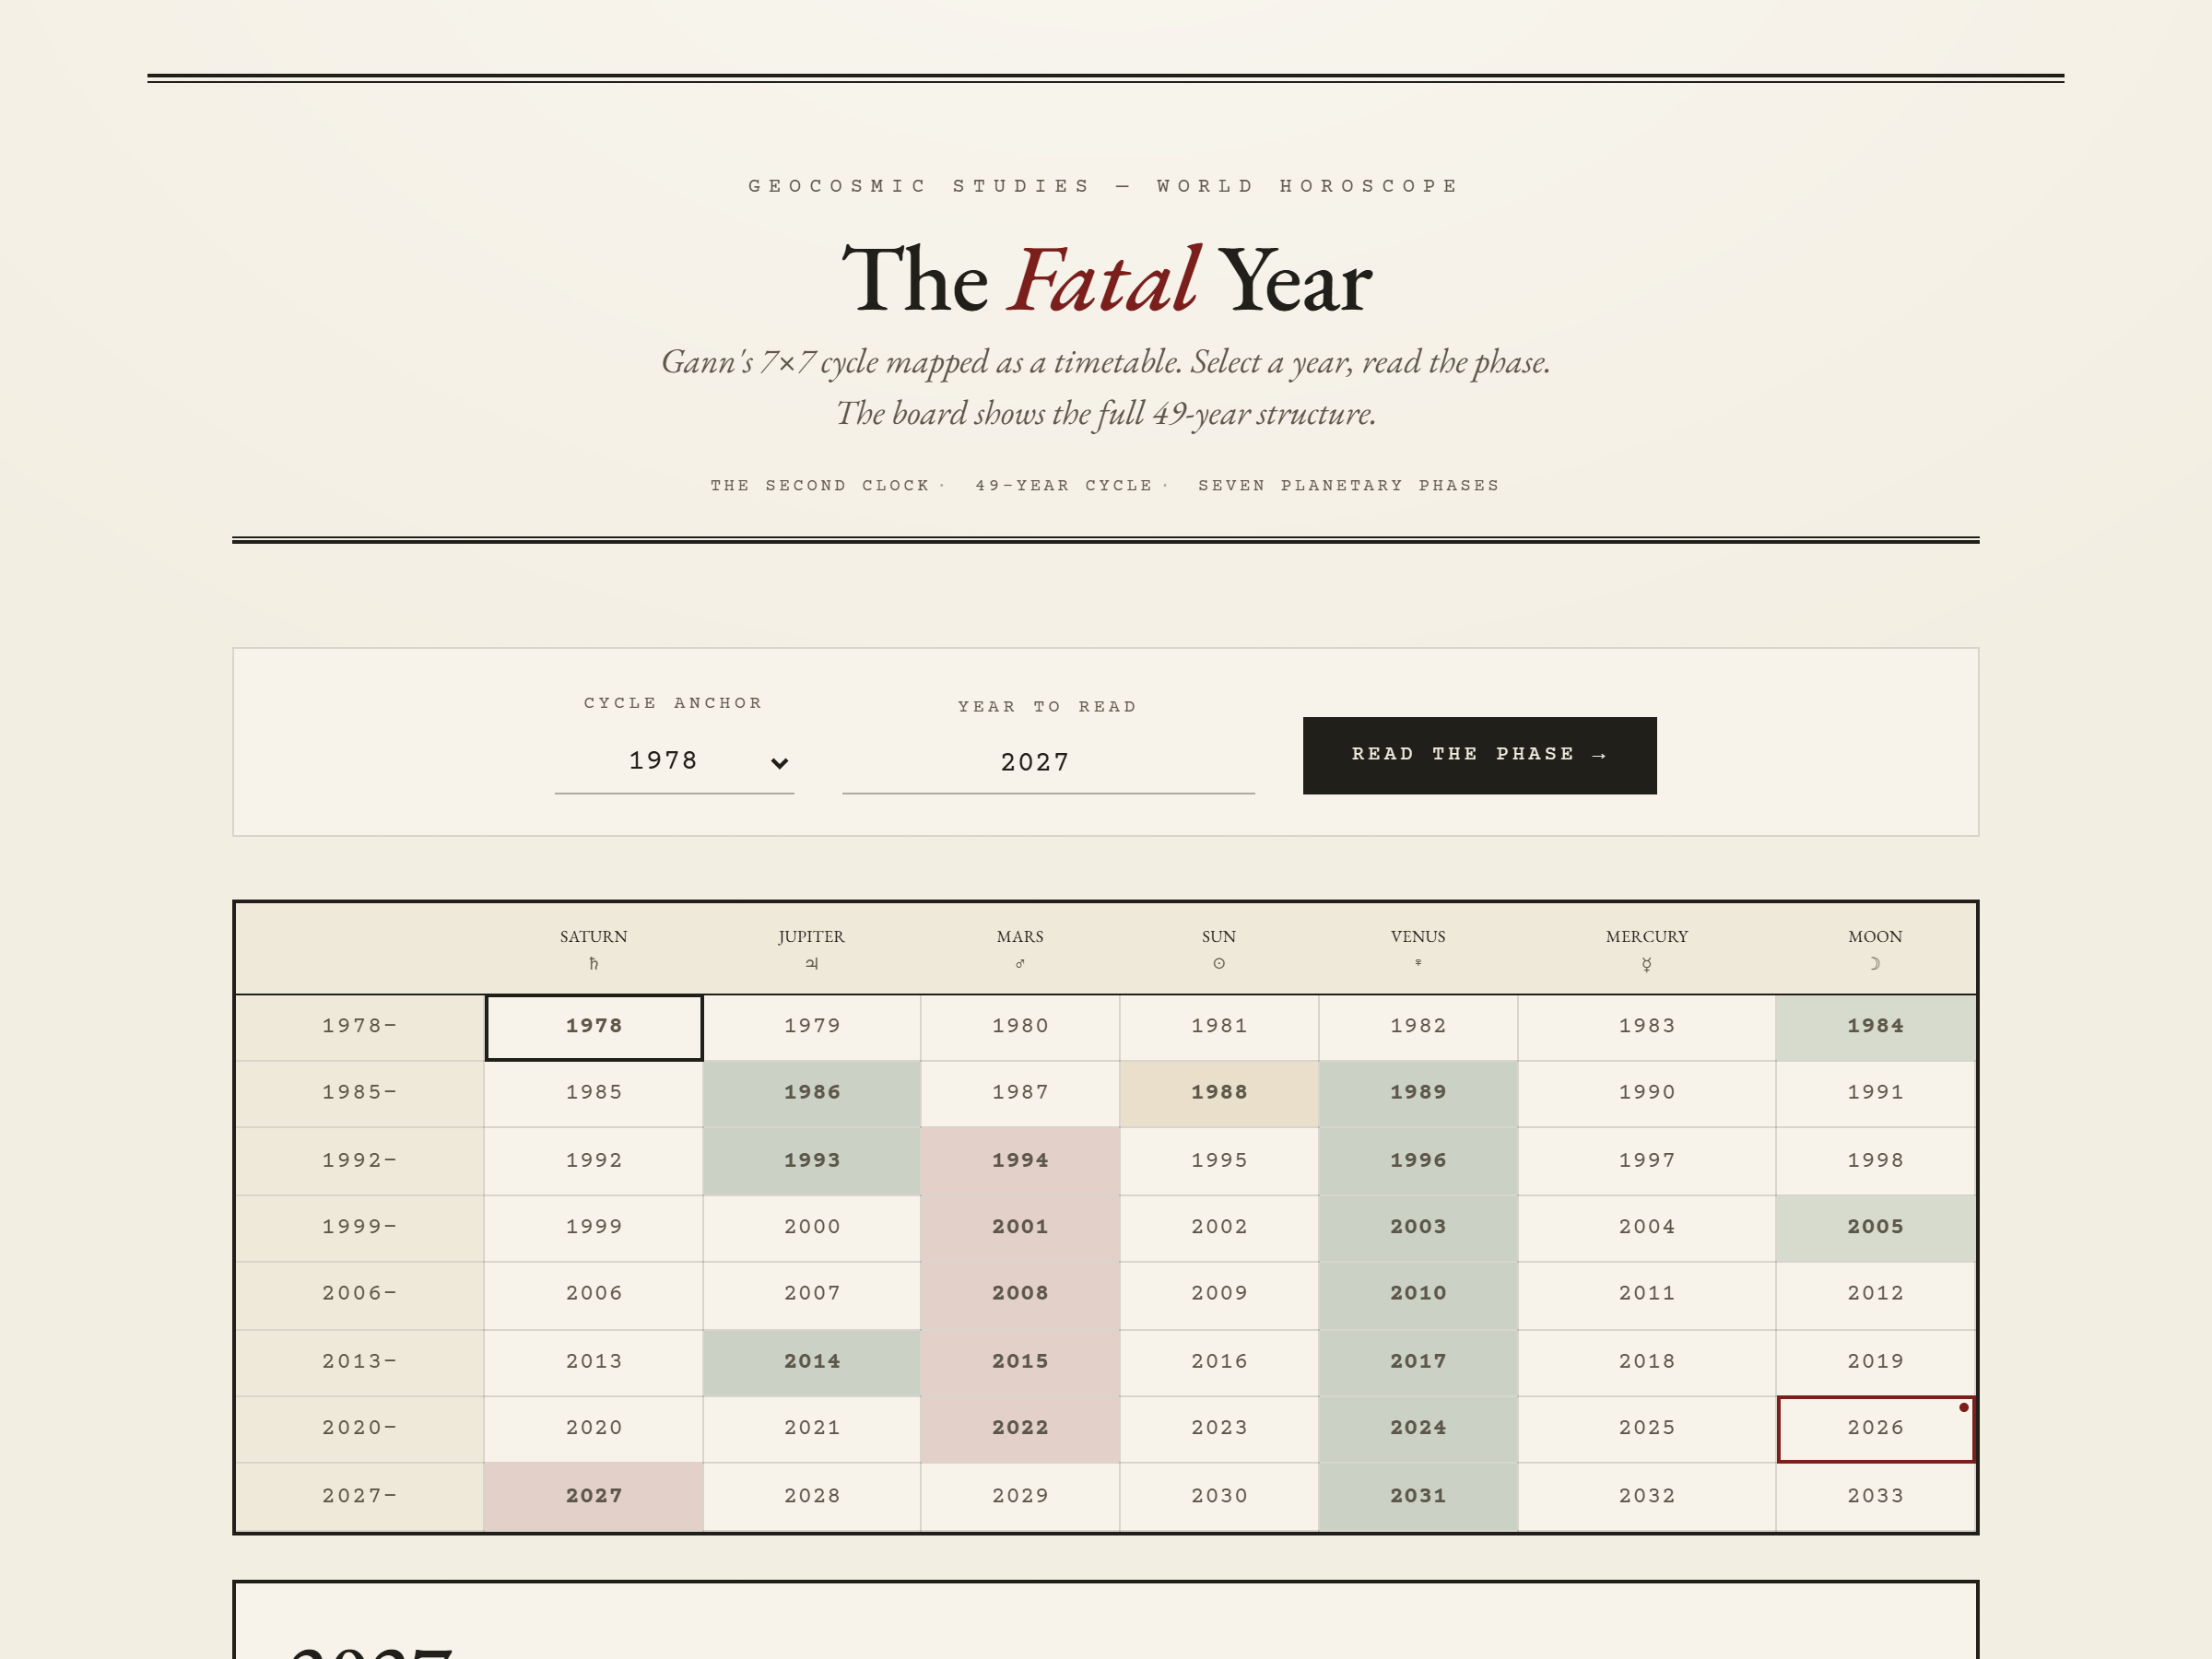
The Fatal Year — the second clock
Gann's 49-year cycle — the square of seven, 7×7 — runs independently of the 36-year world cycle and marks years of structural strain. The cycle is not a trading signal. It is a count of years at which structural pressure concentrates: 1929, 1978, 2027. When the world cycle's inflection falls near a Fatal Year, two independent systems point at the same window. Used alone, the Fatal Year gives a general strain period. Used alongside the world cycle, it gives confirmation or contradiction. You learn to identify the convergence years and to hold them as worth studying — not as predictions of specific events, but as windows where two different measurement systems agree that the year carries unusual weight. The reader who holds both clocks enters 2027 with a structured view of why the year is flagged, what the comparable historical windows produced, and what kind of pressure the cycle says to expect — before the year makes its case.
The best results come from merging the Fatal Year with the longer world cycle — two independent clocks pointing at the same window.
§ The proof walk
The phases were written before the events that tested them.
Below are two kinds of evidence. The historical phases show how the system reads an era at scale — the Skool was not publishing in 1945 or 1939, so these are teaching illustrations, not live calls. The dated Skool cases are from the public record, each with a year, a sector, and a documented outcome. Neither kind proves a future call. Both show why the framework earns serious study. Read each case with its limit attached. That is how the method is taught.
1926–1981
Historical illustration · Aquarian Phase
Sepharial's 1926 text mapped Russia's dominance and the Arab Republic's rise before the Cold War coined either phrase.
The Aquarian Phase from 1945 to 1981 was governed by the Moon. The 1926 text read it as an era of mass movements, popular power, and Aquarian-nation dominance. Aquarius governs Russia and the United Arab Republic. What followed: the Soviet Union dominated the Cold War and the space race. Nasser's Egypt drove the Suez crisis and pan-Arab nationalism. Independence movements swept Africa and Asia. The labour union era rose and peaked in the West. The British Empire — governed by Aries, the opposing sign — declined and ended. Every major theme the system named from the 1926 planetary structure ran in the historical record from 1945 to 1981. The Skool did not publish this call — Sepharial did. This is a teaching illustration, not a forecast the desk made at the time. The point is that the system read 36 years of world history from first-principles planetary structure, before the events that confirmed it.
1987–2022
Backtest · the second clock
The 49-year Fatal Year clusters its strain years across very different markets.
Gann identified a 49-year pattern that marked critical transitions. Backtesting shows the Saturn-to-Saturn years — 1987, 1994, 2001, 2008, 2015, 2022 — frequently sat near major tops. This is the case most likely to be oversold, so read it with care. The clustering is genuine and it is also not a machine. The method is not mechanical. Other cycles, market character, and structure must be merged with it before any reading holds. A strain year is a window to test, not a date to trade. The course teaches the cycle with that restraint built in, because the cluster is convincing enough to make a careless reader reckless.
2016
Course demonstration · World Horoscope
Sagittarius rising in 2016 derived one synthesis: extreme tension in international diplomacy, fragile attempts at order threatened by sudden violent disruption.
The 2016 world horoscope shows Sagittarius rising, Saturn as primary ruler, Mars as secondary. Sagittarius sets the stage as a year of international affairs and diplomacy. Saturn attempts to impose order. Mars threatens that order with sudden disruption. The blended synthesis: a year of extremely tense international diplomacy where fragile agreements collapse under violent pressure. The events of that year — the Brexit vote, the Syrian crisis, the U.S. election — each expressed that dynamic on the world stage. The synthesis was derived from the planetary structure before the year's events were examined. This is the course method in use, not a retrospective reading.
2020
Course demonstration · World Horoscope
Cancer rising in 2020 derived one synthesis: protective control over the masses in their homes.
The 2020 world horoscope shows Cancer rising — the sign of home, protection, and the masses. The Moon governs Cancer: the emotional, the domestic, the collective. The derived synthesis: a year of protective control over populations in their homes, with government authority acting through a Cancer lens. In March 2020, governments worldwide ordered populations indoors. Home became the legal boundary. The protective rationale was explicit. The Cancer rising synthesis named that thematic field before the year's events were examined. The derivation, not the outcome, is what the student learns to produce.
2024
Course demonstration · World Horoscope
Scorpio rising in 2024 derived one synthesis: deep-seated conflicts over debt, resources, and power erupting aggressively onto the world stage.
The 2024 world horoscope shows Scorpio rising, Mars as primary ruler, Jupiter as secondary. Scorpio is the sign of hidden power, debt, and contested resources. Mars drives it aggressively. Jupiter scales it to international dimensions. The derived synthesis: a year where subterranean conflicts over debt, territory, and power break surface and escalate into major international crises. The record: Gaza, Ukraine, election-year institutional pressure across four continents. The course teaches the student to produce this synthesis before examining the record — then to test the derivation against what actually happened.
The synthesis is derived from the planetary structure. The record is checked after. That sequence — derive first, test after — is the discipline the course teaches.
Event-only analysis
You name the event and lose the era it grew from.
The crisis, named after it lands
Each decade read as unprecedented
No nation forecast, only reaction
No structural repeat to research
No second clock, no convergence
With the world cycle
You read the era and the nation before the decade names itself.
The era named from planetary structure
432-year repeat as a research document
Country chart gives the spotlight nation
Prior period shows what the phase favours
Fatal Year confirms or contradicts the window
Proof Walkthrough Video
Optional: instructor walking through the historical backtest on screen.
You have seen Russia named in 1926. The 2016, 2020, and 2024 demonstrations. The next inflection is 2026–2028.
Some readers don't need the rest of this letter. Every section below covers the same ground in more depth. If the record already holds you, here is the door. Walking past it doesn't improve the offer.
AUD $997 · One payment · Lifetime access · NDA and ID verification on enrolment
§ See inside
One of the study plates from inside the course.
The national rulership field. It shows how the method positions nations against the year's pressure. It signals the concept the course teaches without handing over the rules behind it.
Method plate · the national rulership field
§ "But this is just astrology"
The objection is fair. The method does not ask you to believe in stars. It asks you to test a clock.
You see the word horoscope and you reach for the exit. So do I, when it is sold as fortune-telling. A serious forecaster should not accept a model because it sounds impressive. The model has to be tested against time. If it cannot survive a check against the record, it does not belong in your study, and no amount of old language saves it.
A historical model is not accepted because it sounds impressive. It has to be tested against time, with enough restraint that you do not force every headline into it.
Here is what the method actually is. It is history organised as recurring timing structure. The planetary names are the labels Sepharial used; the work is the pattern they point to. A 36-year era. A yearly theme. A national chart. You compare the present phase with prior comparable phases and ask what type of developments appeared. That question is falsifiable. It is also the same question whether the year is 1945 or 2024.
Strip the old vocabulary and the procedure is plain. You are sorting history into a repeating frame and asking what tends to happen at this position in the frame. The labels could be anything. Sepharial used planetary names because that was the notation of his tradition. You could rename every term tomorrow and the method would run unchanged, because the work is in the comparison, not in the words. That is the test of whether something is timing structure or fortune-telling. Fortune-telling does not survive a rename. This does.
The system is history organised as recurring timing structure. You learn to recognise it, not to memorise rules.
So the modern market does not break the method. It is one more period to read. The current phase runs to 2053, and its next inflection forms around 2027. You test the framework against that window the same way you test it against the past.
§ Why now
1945 opened a phase. 1981 opened the next. The current one opened in 2017.
This is a timing window, not a manufactured deadline. The 36-year phase runs to 2053, and the 49-year Fatal Year points near 2027. The two clocks are converging now.
The Saturn in Aries phase runs from 2017 to 2053. Inside it, 2026 to 2028 is an inflection point, and Gann's 49-year Fatal Year points near 2027. The last two comparable inflections were 1945 and 1981. Each one named itself through what arrived. The researcher who held the framework before 1945 watched the Aquarian era open. The one who held it before 1981 watched it close. The next opening is forming now, and the shape of it is visible in the cycle — if you can read it.
Wait a cycle and you do not get a discount. You get the same course in 2028, after the window that shaped the decade has closed and joined the record as history. The reading you did not run on a live year cannot be recovered. 2027 will be documented either way. The question is whether you read it forward or read about it after.
§ What you gain · Three instruments
Three tools come with enrolment.
Each is purpose-built for this method. Enter a year — the instrument computes the structure and returns the result.
I
Gated · Course
The Planetary Year
Enter a year from 1800 to 2142. The tool returns the ruling planet, the character the old texts ascribed to that reign, and the seven-year wheel centred on your chosen year.
II
Gated · Course
The Cycle Builder
Enter any year from 1 BCE to 2485 CE. The tool builds the complete 36-year period grid — rising sign, primary and secondary rulers for all 36 years — plus the yearly and country chart panels.
III
Gated · Course
The Fatal Year
Gann's 49-year (7×7) cycle mapped as a timetable. Select a year, read its phase. The board shows the full cycle colour-coded by phase — death years in crimson, bull phases in green.
§ Why this is gated
A study you keep. Not a feed you follow.
The rules behind this reading — the rising-sign legend, the rulership table, the country charts — are the product. Pull them out of context and they become a horoscope meme that gets quoted wrong for years. A table without the method around it is worse than useless. It looks like the answer and it is only the labels. Gating keeps the work an instrument, and keeps what you paid for from being diluted into free noise. The reason the rules are not on this page is the same reason they hold their value: once they are loose, they are loose for everyone, and the student who paid for the working order is paying for nothing.
You are not buying a forecast. You are learning to read the phase yourself. Once you can locate the era, name the rulers, and run the country check, no one needs to read the year for you again. That skill stays with you for the rest of your study. A subscription rents you someone else's reading and stops the day you stop paying. This is the opposite trade. You learn the instrument once and you keep it for every year the record and the cycle reach. The cost is paid once. The capability does not expire.
Enrolment enters manual review. You submit an NDA and a verification photo — your face beside your government photo ID — through the secure portal, and a team member checks it by hand. The NDA covers no redistribution, no public teaching, and no resale. Access is released once you are approved.
The material is not distributed anonymously. Every student in this program has been verified. You will be too.
The refund clause: If for any reason we cannot verify your identity, no access is released and we work with you directly to resolve it. We don't refund completed enrolments — once verified, the course is in your hands permanently, and we treat that transfer as final. The verification gate is the only point at which money moves backwards.
§ Five parts — what you build
Each part teaches one layer of the reading. By the end you run all three yourself.
The parts stack. The era feeds the year. The year feeds the nation. The Fatal Year is the second clock you read beside all of it.
The instructor · how this course came to exist
I had to work out how a 1926 book read the present, not just the past.
I was building forecasting tools when Sepharial's World Horoscope kept pulling me back. The book described a 36-year world rhythm in coded language, with tables across centuries. I wanted to use it on live markets. The text was written for occultists and Hebrew scholars, not for that. The first year I worked with it, every reading took an afternoon of hand calculation, and most afternoons ended with a result I did not trust.
So I spent four years cross-referencing its claims against the historical record. The order finally surfaced: read the era first, then the year, then the nation. The rising sign sets the stage. The rulers set the action. The country chart says who holds the spotlight. Read in that order, the book stops being vague prediction and starts being structural cycle logic. The tables that had been a wall turned into a procedure once I knew the sequence they were written for.
After that, I could generate a reading for any year in minutes instead of an afternoon of hand calculation. The work moved from setup to interpretation. That is where the real study lives. In the course you watch me run that order on the screen — locate the era, read the year, run the country check — so you see the judgement being made, not just the result. The over-the-shoulder work is the part no book gives you.
I teach it now because the framework is wasted in a drawer, and because most people who meet the book give up at page ten. The honest answer is that it deserves serious students, and serious students deserve the working order, not just the source. I am not handing you a forecast. I am handing you the way I build one.
Part 1
The foundations of the system
You start where Sepharial started. The Chaldean order, the planetary rulers, and the shape of the 36-year framework. By the end you can read the notation the source uses instead of bouncing off it. This is the ground every later layer stands on.
The source notation, decoded for use
The audiobook of Sepharial's 1926 text
A working map of the framework's structure
Part 2
The 36-year cycle
You learn to locate the era you are standing in and the prior periods that rhyme with it. You compare comparable phases and ask what type of pressure appeared. The output is a reading of the climate, which becomes the input for every yearly read that follows.
The phase map, 1873 to 2053
The comparison method for prior eras
The Google Sheet cycle builder
Part 3
Yearly and country cycles
You take a single year and read its rising sign and rulers. Then you run the spotlight check: does the year's sign match a nation's sign? You walk real years yourself, document the reading, and keep a record you can defend rather than a claim you take on faith.
The yearly reading procedure
The country-cycle tools
Your own documented yearly readings
Part 4
The Fatal Year — Gann's 49-year cycle
This is the part that does not appear elsewhere in plain form. You learn Gann's 7×7 cycle as a second clock and read it beside the 36-year rhythm. It is taught with its limits attached: used alone it gives a general idea; merged with the longer cycle it earns its keep. Normally sold separately for AUD $497, it is included here.
The 49-year cycle, read with restraint
The backtest across 1987 to 2022
The convergence method with the 36-year cycle
Part 5
Building a forecast
You combine every layer into one reading: era, year, nation, and the second clock. You run it with the report generator and produce a long-range reading you keep. This is the capability you walk away with for the rest of your study.
The three-layer reading procedure
The horoscope report generator
Future refinements: included as they are added
Gann Fatal Year program · sold separatelyAUD $497
Google Sheet cycle tools and report generatorAUD $400
You gain a usable capability at each step, not only at the end.
At no-refund high ticket, the specifics are the guarantee. Here is what you can do, part by part.
By Part 1
Read Sepharial's notation without bouncing off it.
You open the 1926 text and follow it. The coded planetary notation reads as structure, not a wall.
By Part 3
Read any single year and name the nation in the spotlight.
You run the rising sign, the rulers, and the country check on a year, and document the reading yourself.
By Part 5
Run the full three-layer reading forward.
You combine era, year, nation, and the Fatal Year into one long-range reading, generated with the tools and kept.
After enrolment · Yours forever
Lifetime access — including every future refinement.
All current materials, all updates added over time, all future refinements as they are produced. No subscription. No renewal. No re-purchase. Once you are verified and the NDA is on file, the course is yours for the rest of your career.
§ The method · Further demonstrations
The course teaches the student to derive the synthesis before examining the record.
Two further derivations from the course. Both are derived from the planetary structure first. The historical record is checked after. That is the discipline.
The 2016 world horoscope derived: extreme tension in international diplomacy, fragile attempts at order constantly threatened by sudden violent disruption. The events of 2016 — Brexit, the Syrian crisis, the U.S. election — each expressed that synthesis on the world stage.
2016 · World Horoscope
Course demonstration · M6
The 2020 world horoscope derived: protective control over populations in their homes. In March 2020, governments worldwide ordered populations indoors. The Cancer rising synthesis named that thematic field before the year's record was examined.
2020 · World Horoscope
Course demonstration · M6
§ Enrolment — three steps, operational
What happens after you enrol.
1
Enrol
Complete checkout via the secure page. Your enrolment immediately enters manual review. You will receive a confirmation.
2
Verify
NDA and identity verification protect the student files and the research process. Access is released after verification is complete. If verification cannot be approved, no access is released and we work with you directly to resolve it.
3
Read
Open Part 1 and the source audiobook. Then open the Google Sheet tools and generate your first yearly reading alongside the lessons. You start running the framework on day one, not after it.
§ Objections — eight questions answered directly
Eight questions, answered with specifics.
Do I need to know astrology before I start?
No. Part 1 teaches the notation and the rulers from scratch. If you can read a calendar and follow a table, you have enough. The work is pattern comparison, not belief. You are learning to read a historical frame and ask what tends to appear at a given position in it. The astrology label is the old vocabulary. The skill is comparison.
Sepharial's book is in the public domain. Why pay for this?
The book is the snapshot. The course is the working order. The text takes most readers ten pages to abandon. The course gives you the read sequence, the Google Sheet tools, and the audiobook. You spend your time interpreting instead of decoding. The book is free. The four years I spent working out the sequence are not.
Does this still work on the modern market?
The modern market is one more period to read. Part 3 runs the yearly reading on recent years, and Part 5 runs it forward. The same question — what type of events appeared in comparable phases — works whether the year is 1945 or 2024.
What if I force every headline into the framework?
That is the common failure, and the course is built against it. Part 4 teaches the Fatal Year with its limits attached, and the whole method insists you test a phase against prior comparable phases before you trust a reading. Restraint is part of the training.
Is this a signal service or a trading system?
No. It issues no alerts. It is a geopolitical and historical research method: a structured way to read the climate of a year before events fill it. It is a layer above your existing work, not a replacement for it. You name the era and the season. What you do with that context is your own judgment.
I am not a professional trader. Is this for me?
It is for the student of history who wants the widest lens. If your interest is individual near-term events, start elsewhere. If you want to understand why decades feel structurally different from one another, this belongs in your study.
What is actually original here?
Part 4. Gann's 49-year Fatal Year, taught as a second clock alongside the 36-year rhythm, with the convergence method included. Normally sold separately for AUD $497, it is included here. The convergence — where both cycles point at the same window — is the part you will not find taught in plain form elsewhere.
How long until I can run a reading?
You generate your first yearly reading in Part 3, alongside the tools. The rest extends and refines it. Lessons are self-paced, and the working files are yours for life, so there is no clock on completion.
§ Who this is not for
Four kinds of reader will be better served somewhere else.
If you want a signal feed.
This issues no alerts and no buy or sell calls. It is a study you run yourself. If you want someone to ping you a trade, a signal room will serve you better.
If you want a specific date or price.
The method reads a climate, not a calendar entry. It gives you the type of pressure a year favours, not "the top is the 14th." If you need certainty before you act, this will frustrate you.
If you will not study the source.
The capability lives in the readings you run, not in the videos you watch. If you will not work the framework against real years, you will leave with theory and no skill. The no-refund clause applies.
If you need licensed financial advice.
This is education, not advice. It does not account for your situation or your portfolio. If you need personal financial counsel, see a licensed professional.
If you want to read the climate of a year yourself, and keep that skill for life:
This is built for you. The five parts, the Fatal Year, the Google Sheet tools, and the source audiobook. You walk away able to read the era, the year, and the nation without anyone reading them for you.
§ The decision
The 2017–2053 phase · next inflection near 2027
You become the researcher who holds the era labelled, the nation named, and the next inflection mapped — before the decade finds its headline.
When you understand the cycle, the black swans start to look like predictable expressions of a phase you had already identified.
Five parts · One Fatal Year bonus
The Google Sheet cycle tools
The horoscope report generator
Sepharial's 1926 source audiobook
The three-layer reading method
The 49-year second clock
Future refinements included
Lifetime access after verification
AUD $997
One payment · Lifetime access · NDA + identity verification
Enrolment process — After payment, complete a two-minute identity check via Stripe (government ID + selfie) and sign a non-disclosure agreement. Course access is issued after both are reviewed.
Strict no-refund · NDA and ID verification on enrolment.
Educational content only. Not financial advice. The course teaches a method for reading historical and geopolitical climate; it does not predict specific events and does not guarantee any result. The 2017–2053 phase and the windows named here are study frames. No specific date or price within any window is implied or guaranteed. All markets carry substantial risk. Past performance is not a guarantee of future results. General Advice Warning (Australia): this information is general in nature and does not take into account your personal objectives, financial situation, or needs. Consult a qualified financial professional before making any investment decision.
P.S. — The World Horoscope Course gives you one thing: the ability to name the era, read the year, and identify the nation carrying it — for any year from 1784 to 2053. Five parts, the Google Sheet tools, the source audiobook, and Gann's second clock. Yours for life, one payment. AUD $997 — Enrol in the course →
P.P.S. — 2027 is a Fatal Year. The world cycle puts an inflection in the same window. The last two comparable moments were 1945 and 1981. Study it now, or study it later as a closed chapter.
P.P.P.S. — This is a research method, not a signal feed. It issues no alerts and names no entry points. If you want to hold the era label yourself before the decade writes its name, enrol. If you want someone to hand you the call, this is not it.
The World Horoscope CourseAUD $997 · Lifetime access · NDA and ID verification on enrolment
Enrol today with absolute peace of mind. Study the course material, run the historical cycle calculations, and test the timing models against your own charts. If within 30 full days you are not completely satisfied with the course material and cycle timing models, simply notify us for a prompt, 100% refund. No questions asked.